Notch is a fantastic tool for content creation but that doesn’t mean you can get away without getting technical. When you’re working on large projects with high-resolutions and framerates, it’s important to make sure you technically prepare your Notch projects to run smoothly and consistently. If that wasn’t reason, Notch Blocks are often embedded in another system, and the other system operators won’t want to mess around with your code. The technical thing I’m talking about is optimization! It’s the cornerstone of high-end work and in this post we’re going to look at the Performance panel and some helpful concepts and GPU comparison tricks.
Benchmark first
The first thing you should do before getting into the Performance panel is to benchmark your system inside of Notch. We can do this by going the top menu and selecting Help and then Benchmarking. Once you see the Benchmarking window in the middle of your screen, go ahead and hit Run Benchmark.

When you’re running your benchmark, make sure to stop the timeline in Notch, close down most other applications. This will not only give your benchmark a better score but it’ll also be more similar to an installation system or media server that doesn’t have 50 Chrome tabs open during showtime. Once the benchmarking is done you’ll have a score displayed on your screen. In this example, my laptop’s Geforce 970M scored a 6298:

You don’t need to worry too much about how that number was calculated or what it means because it’ll be mostly used in comparisons later. Once you’ve finished your benchmark, I suggest submitting the results to help add to the comparison database. Now make sure to restart Notch before continuing.
Performance panel
Start by going to View in the top menu and selecting Performance. This will open up the Performance panel by default in the middle of your screen:

The Performance panel isn’t too detail heavy but it has some great resources for a lot of content creators out there. We’ve got the local CPU and GPU frametimes in milliseconds, the local GPU model and benchmark score, and then a target system and target GPU. Let’s break these all down!
What is frametime?
You’re probably used to seeing FPS or frames per second in your transports or timelines. That’s the metric many people use to tell how fast their system is running. But the tricky thing with FPS is that it’s a target, not a measurement. It is the goal number of frames your system wants to output every second, but it’s not actually representative of the amount of processing going on on your system for any particular frame. This is what your frametime is: the amount of milliseconds it takes your system to actually create each frame. The higher this number, the more intensive the processing is. Your CPU and GPU both are working on different things and thus they have different frame times. But what is the limit? How do you know what’s too much?
There are 2 number pairs you need to remember forever: 16ms = 60fps and 33ms = 30fps. If you want to hold 60fps in a project, you need to keep your frame times for each of the CPU and GPU under 16ms. If you want to hold a steady 30fps in a project, 33ms is your magic number. These numbers are based on math, but the math isn’t too relevant in this case, you just need to remember those numbers and do your best to keep your GPU and CPU ms times under that.

Local system vs target system
The local system in this case shows the model of GPU that Notch is running on currently in your system. All the Local GPU millisecond timers are showing how this GPU is running. Simple. The target system is more for guessing how your project will perform on another system. This is incredibly handy in cases where you’re maybe developing on your laptop or home system but know that your project will be run on a totally different GPU in your media server. For many beginner and intermediate creators, this can be a huge stress factor, hoping that your content will run on the target machine. While this system isn’t 100% conclusive or bulletproof, it does provide a very handy relative reference.
Notch takes the benchmark score you received on your GPU and uses it to compare against the benchmark scores of other GPUs to give you an estimate frametime on that system. Again, I have to state it’s not 100% case closed BUT it’s still very helpful. Let’s try an example!
Get Our 7 Core TouchDesigner Templates, FREE
We’re making our 7 core project file templates available – for free.
These templates shed light into the most useful and sometimes obtuse features of TouchDesigner.
They’re designed to be immediately applicable for the complete TouchDesigner beginner, while also providing inspiration for the advanced user.
Comparing your system to the installation system
Let’s say for example I’m on my laptop with a Geforce 970M creating some content but I need to know how my content will run on a disguise 2x2plus. If I don’t have extensive experience with the 2x2plus, this may be a complete mystery to me. Is the 2x2plus stronger or weaker? By how much? For this test I opened up the Particles Lit example that ships with Notch and turned it up to 500k particles and it looks like this:

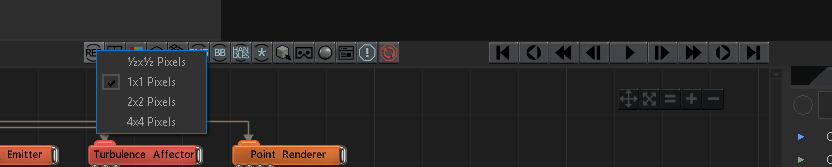
The next thing I want to do is make sure that my Notch application is rendering at the right resolution. This is important because the Performance panel’s comparison calculation is based on the rendered resolution. So if you have your preview window isn’t rendering at the full resolution, your comparison won’t be as accurate as it could be. You can ensure your viewer window is rendering at the right resolution by setting the resolution in the project settings Rendering settings and making sure the viewport resolution is set to 1×1:
Now we can select the GPU/system we want as the target in the Performance panel:

Now we can start our timeline and watch the local GPU time and compare it to the target GPU time:

If we were trying to run our content at 60fps, we’d remember that we have to keep our GPU and CPU times under 16ms. On my laptop we’re holding around 11ms of frametime on the GPU, so it’s running at 60fps…but…on the disguise 2x2plus we can see that the target GPU time estimate is actually 22-23ms. This means that I should already be trying to optimize my content knowing that the GPU capabilities of the 2x2plus in this case are about half of what my system has. This is invaluable information. Without this I’d be totally guessing. I could tweak the content ahead of time by doing things like lowering the amount of particles until I see the target GPU frame time hovering under 16ms meaning this will be MUCH MORE likely to run at 60fps on that system than before:

Now I can be much more confident in delivering a product that will look great but will also perform great.
Wrap up
The ability to compare how your project runs on GPU with how it might run on another system is an amazing feature. It can take the a lot of guesswork and anxiety out of your workflow whether you’re a beginner or advanced developer. Even myself, while I will be intimately familiar with high-end Quadros, I will be using this comparison on all the variety of GPUs and systems that I don’t have familiarity with. I wouldn’t bet my life savings on the estimates, but that doesn’t mean we can’t use the tools we have available to inform ourselves as best we can! Enjoy!